Variation
First, remember that not all variation is bad. Planned variation, like that in an experiment, is a process improvement strategy. Unplanned variation, on the other hand, is nearly always bad.
Two types of variation concern a process improvement team. These are common cause and special cause variation. All processes will have common cause variation. This variation is a normal part of the process (noise). It demonstrates the process’ true capability. Special cause variation on the other hand is not normal to the process. It is the result of exceptions in the process’ environment or inputs.
In a process improvement project, the first step is to eliminate special causes of variation and the second is to reduce common cause variation. Eliminating special causes of variation brings the process into a state of control and exposes the sources of common cause variation.
Common Cause Variation
Common cause variation is intrinsic to the process. It is random in nature and has predictable magnitude. Process noise is another name for it. An example would be the variation in your travel time to work everyday, with the absence of accidental, mechanical, or weather-related delays. When a process is expressing only common cause variation, its true capability for satisfying the customer is discernable. In this circumstance, the process is in control. Note that being in statistical control does not mean that the process is meeting customer expectations. The process could be precisely inaccurate.
Continuing with the travel time example above, one source of common cause variation would be the typical ebb and flow of traffic on your route to work. Remember from the Define Phase that Y = f(x1 + x2 + … + xn). In the example, Y is the travel time and each x is an input that contributes to travel time; examples of x might include time of day or the day of week.
Special Cause variation
Special cause variation is the variation that is not a normal part of process noise. When special cause variation is present, it means that something about the process has changed. Special cause variation has a specific, identifiable cause. An example of special cause variation would be the effect of an accident or a mechanical problem on your travel time to work.
Special cause variation is the first focus of process improvement efforts. When special cause variation exists, it is not possible to determine the process’ true capability to satisfy the customer. This is due to the effect that special cause variation has on inferences about central tendency (average) and standard deviation (spread in the data).
Statisticians have developed specific control chart tests that describe the presence, timing, and behavior of various special cause variation components. These tests point out the impact of variation on the process’ output.
Standard Deviation
Process improvement teams use statistics to describe datasets and to make predictions about the future based on past events. Two important data characteristics used in descriptive statistics are standard deviation and central tendency (average, mean).
Standard deviation is the measure of the dispersion or spread of a dataset. It is one of the more important parameters in statistical analysis. There are different ways to measure this parameter. Some of these are:
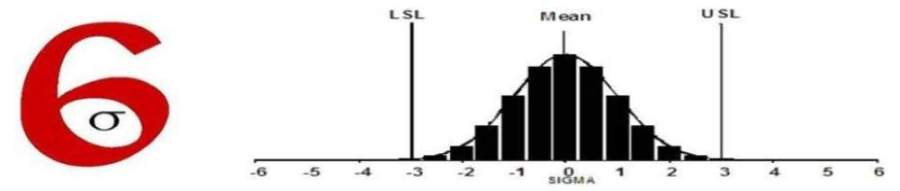
Range: This is the difference between the largest and the smallest observation in a dataset. The range has a variety of uses, including the calculation of control chart control limits. In a normally distributed dataset, with no special cause variation, the range divided by six is an estimate of standard deviation. This is because 99 percent of the observations in a normally distributed dataset, with no special cause variation, fall within ±3 standard deviations from the mean. If the presence of special cause variation is unknown, divide the range by four. Th