Collision Shop Gemba Walks

Shop Walk Throughs (Gemba Walks)

The Lean term for this strategy is Gemba Walks.  It basically means being out in the shop seeing firsthand what is happening.  More specifically, it is about making potential problems more visible.

Here are a few guidelines:

  • Make positive interactions with employees.
  • Ask why things are being done, even if you think you already know. Listen carefully.  You may find that the employee’s view of “why” may be different than yours.  If their answer is “because I was told to”, you have an opportunity to teach. If their answers is that they are adjusting for a defect they inherited, you also have an opportunity to target and correct a problem.
  • Ask yourself if shop rules and procedures sometimes create negative interference with your shop’s goals and   Be careful what you incentivize employees to do, you may get what you ask for. If an employee is pushing a vehicle to completion to meet a scheduled delivery, and is neglecting to fully test vehicle functionality, you are paying for on time delivery with a comeback.
  • Look for cases where trying to “do the right thing” turns out to be the wrong thing.
  • Considering what you know to be defects (comebacks, incorrect ordered parts, missed delivery times, etc) look for potential causes. This involves intimate knowledge of how your shop actually does work, not how you think they are doing work.
  • When you see an improvement opportunity, work with the employee to find a solution. The next day (or opportunity) ask them how the solution is working.  Give them some ownership by letting them shine.
  • Most importantly, these walk throughs are not for the purpose of beating folks up. What you find that requires discipline should be dealt with later and not tied to the walk through in any way.  Obviously, critical things like safety are dealt with immediately.  The point is to have employees see the walk throughs as positive interactions and not witch hunts.

I have always felt that a good shop manager has to have “dirty fingernails”.  These walk throughs help you be seen as a member of the shop floor team and help your employees think like managers.

Have an Opinion?

Everyone has something to say.  Diversity of opinion and perspective is a good thing. In the age of the internet, there is no excuse for not having a venue to express yourself. Leanmeanprocessimprovement.com is a place to post your ideas and perspectives on Six Sigma, Lean, Business Management, and Personal Development.

If you want to contribute comments to existing posts on this website, please register as a user.

If you want to author posts on this website, register as a user and contact me at walt.m@att.net, to get access to author status. You will get full credit for your posts, networking opportunities, and my appreciation.

Calculating Process Yield

Calculating Process Yield by Walter McIntyre

I recently visited several contract manufacturers (CM) to discuss a project I am working on. The purpose of the visits was to evaluate their ability to produce an electronic device we are developing for the automotive industry. One of the production control metrics I asked from each project manager was an estimate of the typical roll throughput yield on their production lines.

Only one of the project managers knew the rolled throughput yield (RTY) on their lines.  All the others gave me a first time yield (FTY) instead. When I pressed each of these about how they manage quality on their production lines, they gave me their version of how failed units are repaired or disposed of before shipping, so that our customers are protected. This approach makes the yield look better than it really is and increases the CM’s cost of production. Make no mistake, increased cost for the CM means increase cost to you, the customer.

The one CM who knew his production line’s rolled throughput yield, also gave me dollar amounts of lost value through wasted components and rework. This CM also addresses the yield issues at each step in their production process with improvement teams.

A significant difference in the quotes received for the CM’s we visited was their circuit board testing schedule. Rather than test every circuit board in the production stream, as the first time yield CM’s did, the CM using roll throughput yield was able to reduce this to 10 percent of every production run. This is a direct result of having good control of their production process. The result was the roll throughput yield CM giving us the lowest quoted cost of production.

This experience led me to write this piece on the various ways to calculate the yield from a process.  If you are a CM, I encourage you to use roll throughput yield and make yourself a hero of cost reduction in your business.  If you are evaluating CM’s for a project, make sure you look hard at the way they calculate yield on their production lines and how they use the results.

First Time Yield (FTY):  The probability of a defect free output from a process is called the First Time Yield. This metric considers only the criteria at the end of the process.  The first time yield is unit sensitive and is calculated by dividing the outputs from a process by its inputs.

The First Time Yield will not detect the effect of hidden factories.  Consequently, it will typically indicate that a process is performing better than it really is.  Even so, this is the most common way to calculate process yield in business today.  This is due, in part, to the way businesses report their performance to financial analysts. It is useful to the business in this way, but First Time Yield will not help the business find and correct problems in their processes.

Rolled Throughput Yield (RTY):  Rolled Throughput Yield is the probability of passing all “in-process” criteria for each step in a process, as well as all end process criteria.  Rolled Throughput Yield is defect sensitive.  Mathematically, Rolled Throughput Yield is the result of multiplying the First Time Yield’s from each process step together.

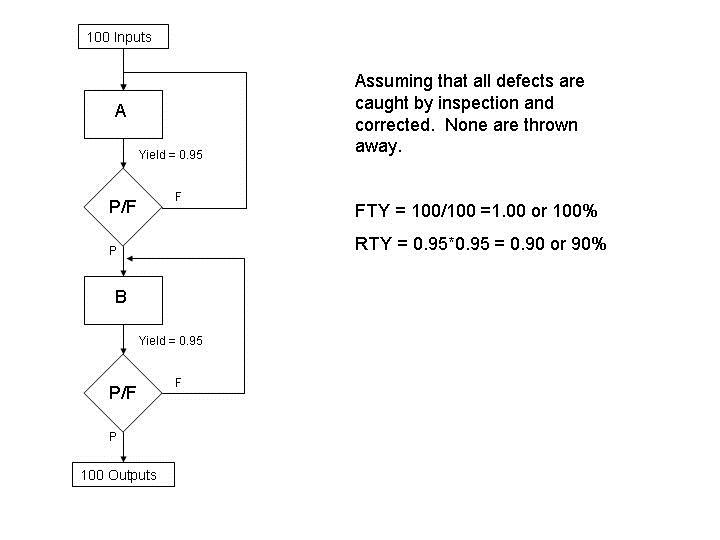
When a process step produces defects, the yield for that step will be less than 100%.  Even if the defective outputs are corrected (a separate process step), the yield for this step is unchanged.  The drawing below shows the relationship between First Time Yield and Rolled Throughput Yield.
Yield

In the example above, the First Time Yield indicates a good process with no defects getting to the customers.  There are 100 inputs and 100 outputs. The First Time Yield does not capture the effect of the 5 % defect rate from each of the process steps.  Ten percent of the outputs are being reworked to keep customers from getting defects.  The process has to do enough work to make 110 outputs to produce the resulting 100, defect free, outputs. The two hidden factories exist because of defect generation and the process owner’s desire for the customer to receive defect free outputs.  The rework (repair or replacement of the 10 defective outputs) will show up as a component of the process’s Cost of Poor Quality.

The rolled throughput yield in the diagram indicates a marginal process because it captures the work done by the two hidden factories.  Instead of a process in 100% compliance, as described by the first time yield, rolled throughput yield describes a process that wastes 10 % of its resources.

These calculations demonstrate the difference between an “As we think it is” process and an “As is” process.  As a result, they point the way to where improvement efforts are needed.


Lean Six Sigma and Chaos

One of the fundamental flaws with process improvement programs is the assumption that all aspects of a business environment are determinant and predictable to a high degree of precision. Certainly some business systems and functions fall into this highly predictable category and fit well into the various quality programs we have seen.
What happens, though, when you try to apply Six Sigma tools to a process or function that is indeterminate? The answer is that incorrect conclusions can be drawn. To be clear, predictions that have a higher precision than the evaluated process or function is capable of, need to be viewed with suspicion. Examples of indeterminate systems are the weather and search engine impressions that a keyword receives on a periodic basis.
The internet, like the weather is an indeterminate system. With indeterminate systems, macro (low precision) predictions can be made reliability (hot in summer, cold in winter) because at the macro level indeterminate systems demonstrate repeatable cyclic behavior. At the micro level, though, this repeatable cyclic behavior becomes less consistent and less reliable. For more on this read the work of Edward Lorenz regarding chaos and weather prediction.
Getting back to the internet, economic systems are indeterminate. This does not mean that Six Sigma tools cannot be applied to indeterminate systems like internet search engine key word impressions. It is instead a matter of using the right tool for the job. In indeterminate systems, since you cannot control or adequately predict all of the variables in the system being worked on, a Six Sigma project team will focus on less precise factors (macro). This means statistical inferences that have much higher standard deviation parameters and may even defy statistical evaluation altogether.
With indeterminate systems, the Six Sigma team will be trying to reduce uncertainties surrounding the system and determine the boundaries associated with these uncertainties. We have to realize that we cannot increase the precision of an indeterminate system beyond the system’s natural state. We can, though, control the precision of how we react to the system’s behavior.
With internet impressions, you may not be able to predict search engine behavior very far into the future, but you can calibrate how you will act to take advantage of what you see. For example, you can build a website that is robust enough to deal with the uncertainty of web searches on the internet. You can also take more frequent measurements of key word impressions and use pay per click tools to react to the impression “terrain”.
Basically, what I am saying is that with determinate systems, Six Sigma teams can work directly on the process to reduce variation and improve performance. With indeterminate systems, the team must work with the uncertainty that exists outside the process to improve performance.